Based on samples of asymptomatic populations, there could be as many as 60 million people in the US with active SARS-COV-2(COVID-19) infections: A back-of-the-envelope calculation.
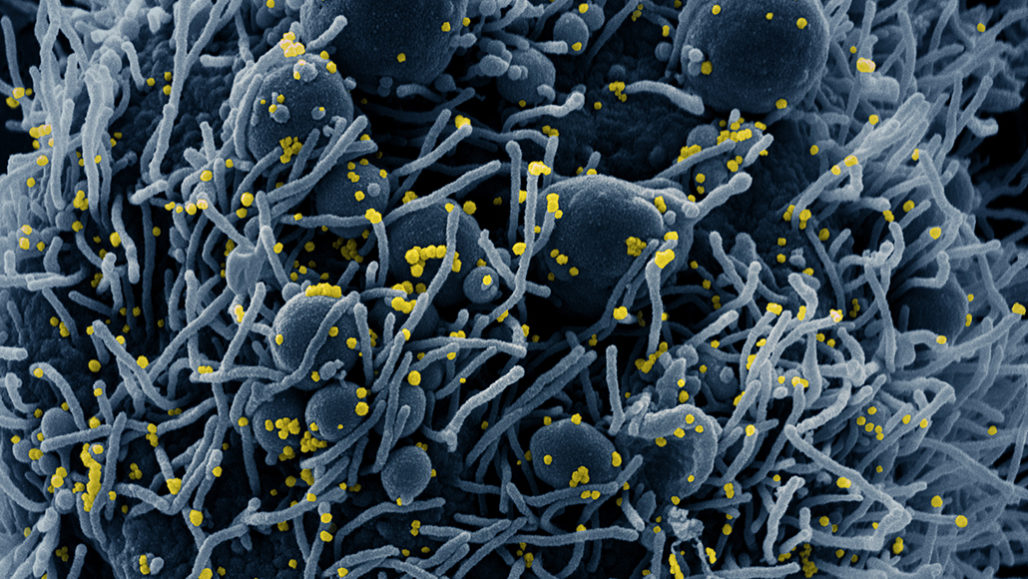
SARS-COV-2 electron micrograph from NIAID– CC license
We know from previous research reported on here that tests of populations without symptoms have shown 20% or more are shedding virus at the time of testing. We don’t know how long they will continue to shed, whether they will develop symptoms later, or what percentage of false negative tests are in these samples. We also don’t know if asymptomatic shedders will develop protective antibodies with time, although that seems reasonable.
With that in mind, we could look at the total population of the United States and say, “how many are now infected?”– although we know the infection rate varies with location, age, and many other factors. Some areas have many infections and rapid spread: mostly large cities. Other areas have few infections but also have rapid spread: mostly rural areas and small towns. A few areas have almost no infections and very slow spread: isolated places.
Just by adding up those two numbers– the percentage of positives in screening studies (ones that sample everyone in a group) and the number of people in the US– we get, veryveryvery roughly, 60 million people. That result is absurd. How could so many people be infected only three months after the introduction of this virus to the US?
The famous author of the web site fivethirtyeight, Nate Silver, introduced an Excel spreadsheet on April 4 that models the spread of SARS-COV-2. The post is titled “Coronavirus case counts are meaningless– unless you know something about testing. And even then it gets complicated.” He links to the spreadsheet at the very end of the post because there is a great deal you need to know before you start playing with the model– and when you look at the spreadsheet, you tend to forget about everything else and possibly ignore the warnings in his post. So read the post carefully, then come back here.
Once I had the spreadsheet in my hot little hands (with the help of an introductory offer from Microsoft for Excel itself), I was entranced. I raised the number of people in the model from 10 million to 330 million and started tweaking the R (the actual number of people to whom each infected person passes the virus). I changed the initial number of people introducing the infection from one to five. I found that, with an R of 3 (well within the range of actual estimates) that dwindled starting on March 1 gradually to 0.4 (consistent with the time that the country went on lockdown), the numbers of actually infected people were staggering. By the end of March, there would be over 110 million people infected.
With an R of 2.7 (the conservative R that the model was shipped with), there would have been 36 million infected by the end of March and 40 million by today. Thereafter, with a lockdown in effect and an R of 0.4, the pandemic would die out. The same is true of most models with a lockdown date of March 1; by now, the infection would be dwindling and very few more people would become infected.
Under these models, with a maximum testing rate of 2 million a day, there would have been about 1.5 million cases detected by today. Unfortunately, there were only 100,000 to 150,000 tests run a day this last week. There have been numerous bottlenecks in raising the test rate, including shortages of swabs and reagents, but in general there has been a lack of federal will and direction to ramp up testing. Despite the population’s worries and the nearly nationwide lockdown, shortages of tests and personal protective equipment (PPE) have continued to hamper our reaction to this pandemic. At the federal level the response is obtuse, opaque, and corrupt.
Based on this simple model, which is available to everyone to tweak and study as they wish, there are possibly on the order of 50 to 80 million people in the US who have had or are having an infection with the novel coronavirus. This guess is really staggering, but it’s based on some simple calculations from real-world numbers.
There is another real-world number that may be consistent with these estimates: yesterday over 1200 people died with COVID-19, not counting the deaths that New York added that had been missed before. Deaths with this virus tend to lag actual infections by two weeks: those who fall ill often seem to be getting along all right until the second week, when they gradually or suddenly start to go downhill and die.
Many of these late deaths may be related to an immune reaction to the virus that surges out of control, attacking the body as well as the virus. Lung, kidney, muscle, brain, and heart tissues seem to be breaking down as the infection progresses. There are also a few who die very quickly very early in the disease process. Some of these people were found at home dead and not counted before.
There is no estimate in the spreadsheet for deaths related to the virus, but this could be easily added. The death rate in the US appears to be roughly 4-5% of those infected. However, accounting for inapparent infections, the death rate may be as low as 0.4%.
My conclusions are that no-one knows how many people in the US have the virus. No-one will know for a long time. By then, we will be left with a wrecked economy and a much larger number of poor people. We will be mourning for many famous people. In November, we will find out whether this nightmare will get worse or will get better. You know what to do– “vote the bums out”.
