Realistic Picture of Election Results
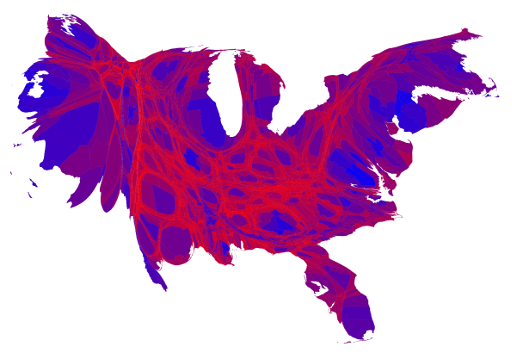
This picture shows the election results in shades of red, blue, and purple to indicate relative percentages of votes; more importantly, it shows relative population figures instead of coloring states all one color based on their areas. This picture is far more realistic than the one usually shown, which exaggerates the relative size of rural areas with small populations, making it look as if most of the country voted for the orange person instead of the old lady, when in fact most of the population actually voted for the old lady, just the rural states with tiny populations in huge areas voted for the orange person.
This map was made by Mark Newman in the Physics department at the University of Michigan. This and other maps of the election are on the following web page: here. The adjustments used to make the maps more realistic are explained on the frequently-asked-questions page here.
